Introducing Amazon CodeWhisperer Dashboard and CloudWatch Metrics
October 16, 2023Amazon CodeWhisperer, the AWS AI coding companion, can significantly improve developer productivity. Based on generative AI technology, Amazon CodeWhisperer offers contextualized code snippets, or recommendations, based on natural language prompts to build software quickly, responsibly, and securely. It enables productivity gains and increases accuracy for accelerated digital transformations. Amazon CodeWhisperer ensures enterprises have greater control over AI-generated code, especially the code written by developers who may have a limited understanding of code attribution, quality, and security requirements.
When I work with individual developers, they immediately recognize the productivity gains CodeWhisperer offers. However, it can be difficult to measure that impact across the entire organization. Development managers want to understand how many developers use CodeWhisperer, how often they use it, and how often they accept the suggestions that CodeWhisperer recommends. CodeWhisperer recently announced the availability of Amazon CloudWatch Metrics and the CodeWhisperer Dashboard to answer these questions. The CodeWhisperer dashboard and metrics provide insightful data about how your developers use the service.
In this post, I will walk through the new metrics and dashboard options. Note that these features are only available in CodeWhisperer Professional. If you have not configured CodeWhisperer Professional, you can follow the instructions in the CodeWhisperer User Guide. For the remainder of this post, I will assume that you have configured CodeWhisperer Professional are logged into the AWS Console as a CodeWhisperer Administrator.
Using the CodeWhisperer Dashboard
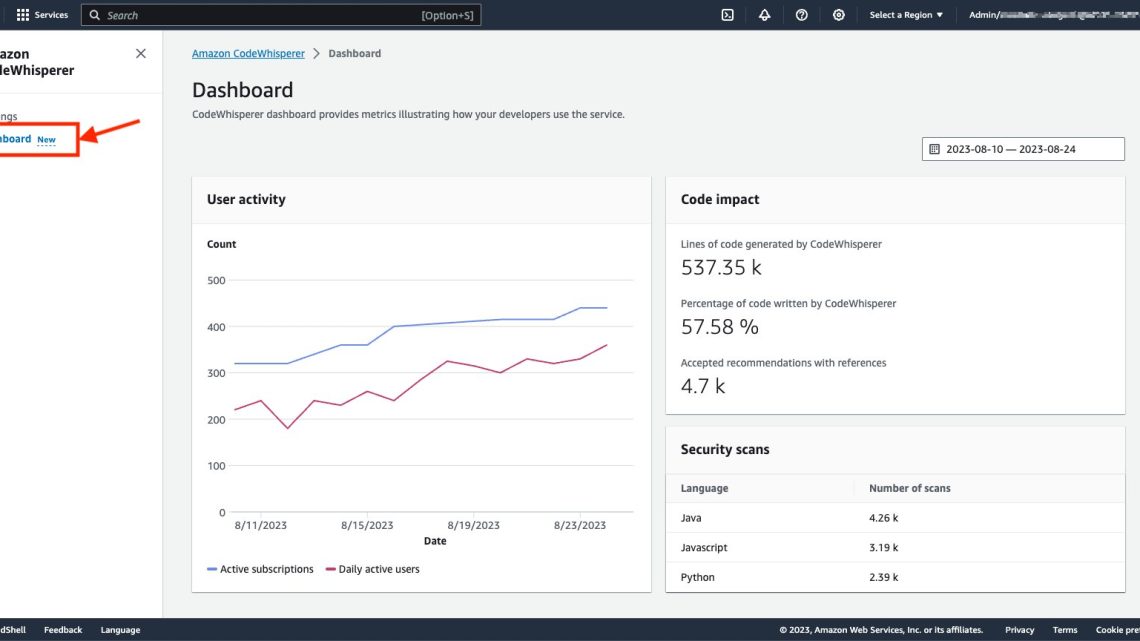
CodeWhisperer now includes a dashboard, shown in the following image, to help you understand how your developers are using CodeWhisperer. This dashboard is designed to answer the most common questions.

The CodeWhisperer Dashboard includes the following sections:
User activity: The User activity section includes the active subscriptions and daily active users. Active subscriptions indicate how many CodeWhisperer seats you have provisioned, while daily active users indicate how many of those seats are used on a daily basis.
Code impact: The Lines of code generated by CodeWhisperer indicates how many lines of code were suggested by CodeWhisperer and accepted by your developers. The percentage of code written by CodeWhisperer indicates how much of your total code is made up of suggestions from CodeWhisperer. This is a great indication of the value your developers are gaining from the service. Accepted recommendations with references indicates the number of suggestions from CodeWhisperer that are based on open-source projects, the references to which CodeWhisperer makes available to you.
Security scans: CodeWhisperer security scan is a tool that helps identify security vulnerabilities in your developers’ code. The data shown indicates how many scans your developers have run in their Integrated Development Environment (IDE).
Using CloudWatch Metrics
While the CodeWhisperer Dashboard will address the most common questions, CodeWhisperer records additional data that may be of interest. CodeWhisperer records these as Amazon CloudWatch metrics, allowing you to create alarms, and custom dashboards. CodeWhsiperer records CloudWath metrics with various levels of granularity. First, CodeWhisperer records a few high-level metrics as shown in the following image. Most of these already appear on the Dashboard, including the SubscriptionCount, ActiveUsers and Invocations. However, it is still useful to have them in CloudWatch so you can set alarms and build your own dashboards.

Diving a little deeper, you may want to understand how CodeWhisperer is used for specific languages. For example, I may want to understand how CodeWhisperer benefits the front-end developers, who use JavaScript, and compare that with the back-end developer, who use Python. I can do this by leveraging the Programming Language dimension as shown in the following image. In addition, I could use a CloudWatch Math Metric to calculate the percent of code written by CodeWhisperer by dividing CodeWhispererCharacterCount by TotalCharacterCount.

Finally, if you want to dive even deeper, you could can use the more granular CompletionType, ProgrammingLanguage, SuggestionState dimension. For example, in the following image I have filtered for only block (i.e. full function) completions of SQL that were accepted by the user. I can then graph or set alarms for Invocations, Generated Line Count, Suggested Reference Count, and Latency.

CodeWhisperer Customizations
Swami Sivasubramanian recently announced Amazon CodeWhisperer customization capability to generate more relevant code recommendations informed by your organization’s code base. This capability uses the latest model and context customization techniques and will be available in preview soon as part of a new CodeWhisperer Enterprise Tier. With this capability, CodeWhisperer has added additional CloudWatch metrics that let you focus on your customizations. In addition, you can filter the CodeWhisperer dashboard by customization, as shown in the following image.

Of course, you can also filter by customization in CloudWatch. CodeWhisperer publishes additional metrics that include the CustomizationARN dimension. You can use these new metrics to gather details on how your customizations are performing. For example, in the following image, I am graphing the accepted suggestions for Java for my CodeWhisperer customization. I can use this to understand how well the custom version of CodeWhisperer is performing and look for opportunities to improve my customizations.

Conclusion
Amazon CodeWhisperer, the AWS AI coding companion, is a giant leap forward in developer productivity. However, in the past it was difficult to measure that impact across the entire organization. CodeWhisperer now support CloudWatch Metrics and along with a new CodeWhisperer Dashboard that provides insightful data about how your developers use the service. These new features provide the tools to understand how your organization is benefitting from CodeWhisperer. You can read more in the CodeWhisperer Documentation.
