Getting Started with Istio on Amazon EKS
December 5, 2023In the dynamic landscape of modern architecture, making microservices work seamlessly in the cloud can be a puzzle. The transition to microservices often brings complexities related to traffic management, security, and observability. This is where Istio steps in, offering a comprehensive service mesh solution that streamlines these challenges. Istio is an open source service mesh platform designed to enhance the management, security, policy enforcement, and observability of microservices-based applications. It’s typically used in complex, distributed architectures where multiple microservices need to communicate with each other. Istio augments Kubernetes by introducing a versatile, application-aware network fabric powered by the robust open source Envoy proxy as a “sidecar” configuration. Deploying Istio in Amazon Elastic Kubernetes Service (Amazon EKS) takes this advantage a step further. It seamlessly enhances the capabilities of Amazon EKS by providing advanced traffic management, security with mutual TLS encryption, and a uniform approach to observability through other open source tools like Prometheus and Grafana.
Lets embark on an exciting journey into the world of Istio with our blog series! We’ll dive into the multiple ways Istio empowers a modern architecture when integrated with Amazon EKS, making it the go-to choice for organizations striving for excellence in their cloud native journey. In this first blog post, we’ll walk you through the process of getting Istio up and running on Amazon EKS. We’ll cover everything from deploying microservices, to testing the communication between these services. Plus, we’ll show you how to visualize all that traffic in action by enabling Istio’s telemetry add-ons for enhanced observability.
We’re thrilled to announce that we’ve recently updated the Istio Platform Setup documentation to include Amazon EKS. This setup uses Terraform-based EKS Blueprints for Istio and we will be using this blueprint in our blog.
Istio Architecture
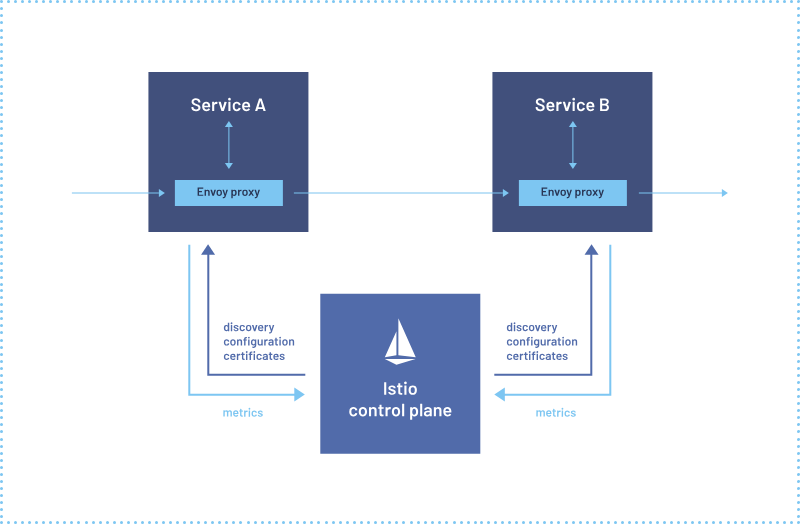
Service mesh architecture tackles the complexities developers and operators encounter in distributed or microservices-based systems. Istio’s architecture consists of two essential components: the data plane and the control plane.
The data plane manages communication between services, enhancing the network’s understanding of traffic by intercepting it. Istio employs a proxy, an extended version of the Envoy Proxy which intercepts all network traffic, enabling a wide range of application-aware features based on configurable rules. Envoy proxies are deployed alongside each service within your Amazon EKS cluster, ensuring they can manage traffic effectively.
The control plane, on the other hand, takes your predefined configurations and applies its understanding of the services to dynamically program the envoy proxy. It continuously updates them to adapt to rule changes or evolving environments, ensuring seamless and secure service-to-service communication within your microservices architecture.

Image courtesy of: https://istio.io/latest/about/service-mesh/
Getting Started with Istio on Amazon EKS
In this blog post, we’ll guide you through a series of essential steps to supercharge your microservices architecture:
- Deploying applications on Amazon EKS: We’ll kick things off by deploying the applications onto Amazon EKS, setting the stage for a resilient and scalable infrastructure.
- Istio Integration: Next, we’ll seamlessly integrate these applications into Istio’s service mesh, unlocking a host of powerful capabilities for traffic management, security, and observability.
- Edge Traffic Management: Then, we will also dive into the intricacies of handling ingress traffic at the edge of your service mesh using Istio Ingress Gateway along with AWS Network Load Balancer, ensuring secure and controlled access to your services.
- Routing with VirtualService: We’ll show you how to finely control ingress HTTP traffic, matching it to the appropriate service within the mesh using Istio’s VirtualService Custom Resource Definition (CRD).
- Visualizing the Magic: Finally we will harness the power of visualization with tools like Kiali, Prometheus, and Grafana.
Deployment Architecture
Throughout this blog, as well as for the upcoming Istio on Amazon EKS blogs, we’ll be leveraging a microservices-based Product Catalog Application as our real-world example. This application will serve as our practical playground, allowing us to explore Istio’s capabilities in a hands-on manner. The application is composed of three microservices: Frontend, Product Catalog, and Catalog Detail.
When a user accesses the application using its URL, the traffic first reaches the Istio Ingress Gateway via AWS Network Load Balancer and then reaches the frontend service (developed in NodeJS). The frontend service then calls the backend service productcatalog (developed in Python) to get the products and the productcatalog in turn calls catalogdetail (developed in NodeJS) backend service to get vendor information.
Kiali is used to gain insights into the versioned application graph, enabling us to visualize and comprehend the intricate relationships between these services. Istio’s metrics will be captured with Prometheus and presented using Grafana, empowering comprehensive observability into these microservices.

EKS Cluster setup
In this blog we will be using this EKS Blueprints for Istio to spin up an Amazon EKS cluster along with the Istio setup and other observability add-ons. Using Terraform-based EKS Blueprints for Istio greatly simplifies the setup and management of Istio in your Kubernetes environment. This blueprint provides a structured and efficient approach to deploying Istio on Amazon EKS, eliminating many of the manual configurations and potential pitfalls. This blueprint will do the following:
- Deploy an Amazon EKS Cluster with one managed node group in a VPC
- Add node_security_group rules for port access required for Istio communication
- Install Istio using Helm resources in Terraform
- Install Istio Ingress Gateway using Helm resources in Terraform (This step deploys a Service of type LoadBalancer that creates an AWS Network Load Balancer).
Clone the repository
Setup EKS and Istio
Using the prerequisites section, install the necessary tools for this setup. Run the following command to update information of available charts locally from chart repositories.
Execute the following sequence of commands to set up the infrastructure. You can also refer to these steps in the Deploy section of the EKS Blueprint.
Note: Proceed to the next step once the Amazon EKS cluster and Istio setup is completed.
Deploying the microservices to Istio Service Mesh
We will be following the steps from the 01-getting-started module of the istio-on-eks Git repository.
Clone the repository
Setup Namespace for Istio Mesh
To be able to deploy the microservices to the Istio Service Mesh automatically, the chosen namespace must be labeled with the label istio-injection=enabled. This will inject the sidecar envoy proxy into the microservices that are part of the “workshop” namespace.
Deploy Helm Chart
Now deploy the provided mesh-basic Helm Chart. This helm chart is packaged with a deployment manifest for:
- All the three microservices (
frontend,prodcatalog, andcatalogdetail) - Istio Gateway and a VirtualService.
Output should be similar to:
Validation
Confirm the installation of microservices in the workshop namespace by running this command:
Output should be similar to what’s shown here, indicating that each of the application pods is running two containers, an application container and an Istio envoy proxy as side-car container.
Application User Interface
The application’s (user interface) URL can be retrieved using the following command:
Accessing this URL in the browser will lead you to the Product Catalog application as shown here:

Using the input form, we can add sample products to the catalog as demonstrated in the following screenshot. When the catalog is refreshed after addition of a product Apples, we see that the catalog detail is retrieved from two vendors: ABC.com and XYZ.com
Note: The page output, under the
Catalog Detail, might differ when adding products compared to the images shown here

Upon refreshing the page few times, you should see the Catalog Detail section toggling between Vendors: ABC.com and Vendors: ABC.com, XYZ.com. This is because the catalogdetail service has two versions v1 and v2 and this vendor information is coming from the respective versions. Depending on the kube-proxy proxy modes, the call to this service can land on either version.

Key Istio Components
In this blog and the upcoming series, we will be gradually introducing all of the Istio core components. For this particular blog, we are focusing on two key Istio elements: Istio Ingress Gateway and VirtualService that are deployed via the Helm chart in the previous step.

Run the following command to list all the Istio resources created:
Output should be similar to:
Istio Ingress Gateway
Istio Ingress Gateway describes a network load balancer operating at the edge of the mesh receiving incoming HTTP/TCP connections. The specification describes a set of ports that should be exposed, the type of protocol to use, and configuration for the load balancer.
In our example, the productapp-gateway Gateway is responsible for defining which hostnames the ingress traffic allows through this gateway, its kind (protocol), and the port at which it is accepted.
Let’s look at the productapp-gateway definition in more detail, by running this kubectl command:
You should see output similar to what’s shown here:
apiVersion: networking.istio.io/v1beta1
kind: Gateway
metadata: annotations: meta.helm.sh/release-name: mesh-basic meta.helm.sh/release-namespace: workshop creationTimestamp: "2023-08-28T22:13:32Z" generation: 1 labels: app.kubernetes.io/managed-by: Helm name: productapp-gateway namespace: workshop resourceVersion: "2436" uid: 8a2e97eb-6879-4005-9864-2990db03b009
spec: selector: istio: ingressgateway servers: - hosts: - '*' port: name: http number: 80 protocol: HTTP
Based on this YAML definition of the Gateway, we can conclude that the productapp-gateway Gateway:
- Is applied to the Envoy proxy of the pod with the label
istio: ingressgateway - Accepts traffic for all hosts
(*) - Accepts traffic on port
80for protocolHTTP
VirtualService
A VirtualService defines a set of traffic routing rules to apply when a hostname is addressed. Each routing rule defines matching criteria for traffic of a specific protocol. If the traffic is matched, then it is sent to a named destination service (or subset/version of it) defined in the registry. Without virtual services, Envoy distributes traffic using round-robin load balancing between all service instances mapped to the hostname. With a virtual service, you can specify routing rules that tell Envoy how to send the virtual service’s traffic to appropriate destinations.
In our example, the productapp VirtualService handles all the web traffic to the Istio Ingress endpoint by forwarding it to the frontend destination service.
You should see output similar to what’s shown here:
kind: VirtualService
metadata: annotations: meta.helm.sh/release-name: mesh-basic meta.helm.sh/release-namespace: workshop creationTimestamp: "2023-08-28T22:13:32Z" generation: 1 labels: app.kubernetes.io/managed-by: Helm name: productapp namespace: workshop resourceVersion: "2440" uid: 3ebc2a6f-0ef8-40b9-9fc3-dba326039577
spec: gateways: - productapp-gateway hosts: - '*' http: - match: - uri: prefix: / route: - destination: host: frontend port: number: 9000
Based on this YAML definition of the Gateway, we can conclude that the productapp VirtualService :
- Is associated specifically with
productapp-gatewayGateway and any ingress traffic through it - Matches any host name
(*)of theHTTPtraffic - When matched with no specific context path
(/)in the request URI, routes the traffic to thefrontenddestination service.
Visualization
Now that we have demonstrated how to deploy services into Istio Service Mesh, let’s get into how you can visualize the service mesh with Kiali and its metrics in Grafana.
Kiali
Kiali is a console for Istio service mesh and we will be using Kiali to validate our setup. Kiali should already be available as a deployment in the istio-system namespace if you have setup Istio using the EKS Istio blueprint we shared before.
Note: A complete overview of Kiali is beyond the scope of this blog post
To be able to access the Kiali console, port-forward the Kiali service endpoint onto your local machine with the following command:
Use your browser to navigate to http://localhost:20001. In the Kiali console one can visualize all the microservices deployed in the Istio Mesh and how they interact with one other in the form of a directed graph. To see this in action, click Graph on the menu on the left and when presented with an Empty Graph as shown here, click on the Display Idle Nodes button.

When the view with the application node loads, customize the view further by observing the highlighted portions of the screenshot presented here and replicating the same in your environment. To see a similar graph to what we have displayed here in our screenshot, change the time on the right corner to “Last 10m.”

We note the following in this screenshot:
- The △ represents the Kubernetes service
- The ▢ represents the versioned application workloads. In our example, we have
v1versioned workloads forfrontendandproductcatalogv1andv2versioned workloads forcatalogdetail
- The boxes encompassing a service and the versioned application workloads, collectively represent an Ⓐ application.
- The icon like the one we have shown here represents a VirtualService that points to an actual Kubernetes service such as
frontendin this example.

Grafana
Grafana allows you to query, visualize, alert on and understand your metrics no matter where they are stored. As with Kiali, Grafana should also be already available as a deployment in the istio-system namespace if you have setup Istio on EKS with the blueprint provided.
Note: A complete overview of the Grafana is beyond the scope of this blog post
To access the Grafana console, port-forward the Grafana service endpoint onto your local machine with the following command:
Use your browser to navigate to http://localhost:3000/dashboards.

Navigate into each of the provided Dashboards by clicking on the names as shown in this image. For example, when you navigate to the Istio Control Plane Dashboard you should see a dashboard similar to the image shown here.
Control Plane Dashboard monitors the health and performance of the control plane. Use this link to get details on all dashboards available out of the box: https://istio.io/latest/docs/ops/integrations/grafana/

Testing
We have so far visualized how the services link to one another in Kiali when there wasn’t any traffic. In this section we will go a step further and generate traffic to visualize in even more detail the following aspects and more:
- Traffic rate
- Traffic distribution
- Throughput
- Response time
- Traffic animation between services
Generating Traffic
Let’s generate some traffic for our application. Use the siege command line tool to generate traffic to the application’s (user interface) URL by running the following commands in a separate terminal session.
While the load is being generated, access the kiali console you previously configured and you should notice that the traffic is flowing in the manner shown in this screenshot. The traffic originates, from the left at the istio-ingress, hops through frontend and productcatalog, ending finally with catalogdetail service which then forwards/round-robin (depends on kube-proxy proxy modes) the traffic to either of its versioned workloads.

Observations
Based on traffic animation captured in Kiali as a result of our load test, we can conclude that:
- The Ingress traffic directed towards the
istio-ingressis captured by the Gatewayproductapp-gatewayas it handles traffic for all hosts(*) - Traffic is then directed towards
productappVirtualService as its host definition matches all hosts(*) - From
productappVirtualService, the traffic reachesfrontendmicroservice as the context-path matches/, from there moves toproductcatalogand then finally tocatalogdetail. - The
catalogdetailservice, as expected, randomly splits the traffic betweenv1andv2versions.
Cleanup
To clean up your EKS environment and remove the services that were deployed, please run the following commands:
To further remove the EKS cluster with deployed Istio that you might have created in the prerequisite step, run the commands provided here.
Conclusion
As we wrap up this inaugural blog in our Istio on Amazon EKS series, we hope you’ve gained valuable insights into the potential of Istio within Amazon EKS. From deploying microservices to mastering Istio’s Gateway and VirtualService, you’ve embarked on a journey towards a more resilient, secure, and observable microservices architecture. But hold onto that excitement because the adventure is far from over. In our next installment, we’ll delve deeper into Istio’s advanced features, exploring topics like traffic management, mTLS, and the art of fine-tuned observability. Get ready to level-up your microservices game with Istio, and stay tuned for the next thrilling chapter!
