Reducing Your Organization’s Carbon Footprint with Amazon CodeGuru Profiler
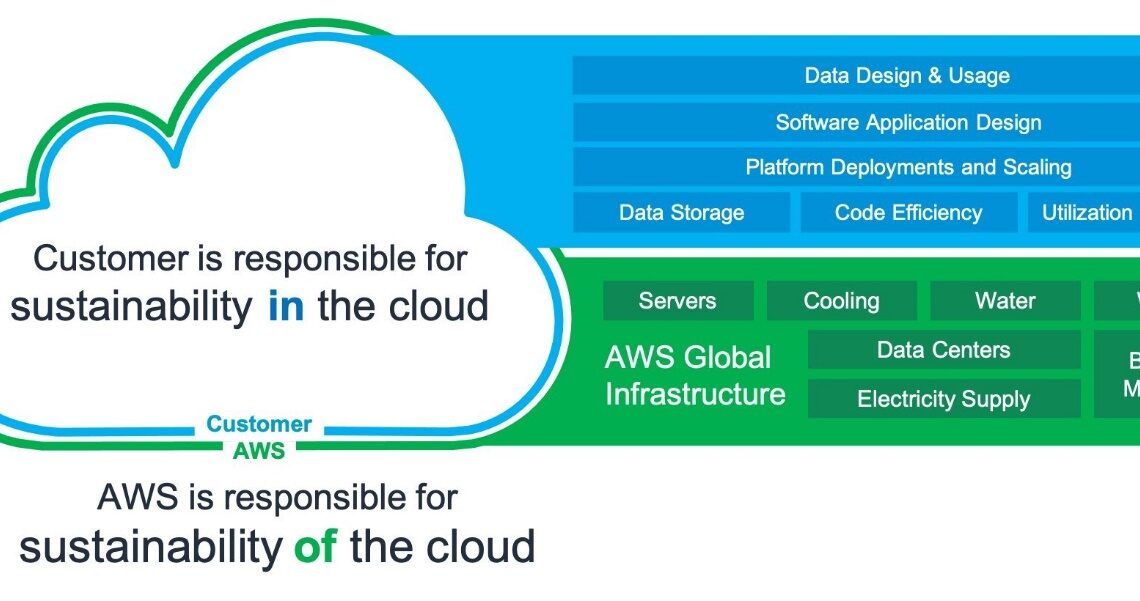
February 2, 2023It is crucial to examine every functional area when firms reorient their operations toward sustainable practices. Making informed decisions is necessary to reduce the environmental effect of an IT stack when creating, deploying, and maintaining it. To build a sustainable business for our customers and for the world we all share, we have deployed data centers that provide the efficient, resilient service our customers expect while minimizing our environmental footprint—and theirs. While we work to improve the energy efficiency of our datacenters, we also work to help our customers improve their operations on the AWS cloud. This two-pronged approach is based on the concept of the shared responsibility between AWS and AWS’ customers. As shown in the diagram below, AWS focuses on optimizing the sustainability of the cloud, while customers are responsible for sustainability in the cloud, meaning that AWS customers must optimize the workloads they have on the AWS cloud.

Figure 1. Shared responsibility model for sustainability
Just by migrating to the cloud, AWS customers become significantly more sustainable in their technology operations. On average, AWS customers use 77% fewer servers, 84% less power, and a 28% cleaner power mix, ultimately reducing their carbon emissions by 88% compared to when they ran workloads in their own data centers. These improvements are attributable to the technological advancements and economies of scale that AWS datacenters bring. However, there are still significant opportunities for AWS customers to make their cloud operations more sustainable. To uncover this, we must first understand how emissions are categorized.
The Greenhouse Gas Protocol organizes carbon emissions into the following scopes, along with relevant emission examples within each scope for a cloud provider such as AWS:
- Scope 1: All direct emissions from the activities of an organization or under its control. For example, fuel combustion by data center backup generators.
- Scope 2: Indirect emissions from electricity purchased and used to power data centers and other facilities. For example, emissions from commercial power generation.
- Scope 3: All other indirect emissions from activities of an organization from sources it doesn’t control. AWS examples include emissions related to data center construction, and the manufacture and transportation of IT hardware deployed in data centers.
From an AWS customer perspective, emissions from customer workloads running on AWS are accounted for as indirect emissions, and part of the customer’s Scope 3 emissions. Each workload deployed generates a fraction of the total AWS emissions from each of the previous scopes. The actual amount varies per workload and depends on several factors including the AWS services used, the energy consumed by those services, the carbon intensity of the electric grids serving the AWS data centers where they run, and the AWS procurement of renewable energy.
At a high level, AWS customers approach optimization initiatives at three levels:
- Application (Architecture and Design): Using efficient software designs and architectures to minimize the average resources required per unit of work.
- Resource (Provisioning and Utilization): Monitoring workload activity and modifying the capacity of individual resources to prevent idling due to over-provisioning or under-utilization.
- Code (Code Optimization): Using code profilers and other tools to identify the areas of code that use up the most time or resources as targets for optimization.
In this blogpost, we will concentrate on code-level sustainability improvements and how they can be realized using Amazon CodeGuru Profiler.
How CodeGuru Profiler improves code sustainability
Amazon CodeGuru Profiler collects runtime performance data from your live applications and provides recommendations that can help you fine-tune your application performance. Using machine learning algorithms, CodeGuru Profiler can help you find your most CPU-intensive lines of code, which contribute the most to your scope 3 emissions. CodeGuru Profiler then suggests ways to improve the code to make it less CPU demanding. CodeGuru Profiler provides different visualizations of profiling data to help you identify what code is running on the CPU, see how much time is consumed, and suggest ways to reduce CPU utilization. Optimizing your code with CodeGuru profiler leads to the following:
- Improvements in application performance
- Reduction in cloud cost, and
- Reduction in the carbon emissions attributable to your cloud workload.
When your code performs the same task with less CPU, your applications run faster, customer experience improves, and your cost reduces alongside your cloud emission. CodeGuru Profiler generates the recommendations that help you make your code faster by using an agent that continuously samples stack traces from your application. The stack traces indicate how much time the CPU spends on each function or method in your code—information that is then transformed into CPU and latency data that is used to detect anomalies. When anomalies are detected, CodeGuru Profiler generates recommendations that clearly outline you should do to remediate the situation. Although CodeGuru Profiler has several visualizations that help you visualize your code, in many cases, customers can implement these recommendations without reviewing the visualizations. Let’s demonstrate this with a simple example.
Demonstration: Using CodeGuru Profiler to optimize a Lambda function
In this demonstration, the inefficiencies in a AWS Lambda function will be identified by CodeGuru Profiler.
Building our Lambda Function (10mins)
To keep this demonstration quick and simple, let’s create a simple lambda function that display’s ‘Hello World’. Before writing the code for this function, let’s review two important concepts. First, when writing Python code that runs on AWS and calls AWS services, two critical steps are required:
- Importing the AWS SDK for Python (Boto3), and
- Creating the AWS SDK service client.
The Python code lines (that will be part of our function) that execute these steps listed above are shown below:
import boto3 #this will import AWS SDK library for Python
 VariableName = boto3.client('dynamodb’) #this will create the AWS SDK service client
Secondly, functionally, AWS Lambda functions comprise of two sections:
- Initialization code
- Handler code
The first time a function is invoked (i.e., a cold start), Lambda downloads the function code, creates the required runtime environment, runs the initialization code, and then runs the handler code. During subsequent invocations (warm starts), to keep execution time low, Lambda bypasses the initialization code and goes straight to the handler code. AWS Lambda is designed such that the SDK service client created during initialization persists into the handler code execution. For this reason, AWS SDK service clients should be created in the initialization code. If the code lines for creating the AWS SDK service client are placed in the handler code, the AWS SDK service client will be recreated every time the Lambda function is invoked, needlessly increasing the duration of the Lambda function during cold and warm starts. This inadvertently increases CPU demand (and cost), which in turn increases the carbon emissions attributable to the customer’s code. Below, you can see the green and brown versions of the same Lambda function.

Now that we understand the importance of structuring our Lambda function code for efficient execution, let’s create a Lambda function that recreates the SDK service client. We will then watch CodeGuru Profiler flag this issue and generate a recommendation.
- Open AWS Lambda from the AWS Console and click on Create function.
- Select Author from scratch, name the function ‘demo-function’, select Python 3.9 under runtime, select x86_64 under Architecture.
- Expand Permissions, then choose whether to create a new execution role or use an existing one.
- Expand Advanced settings, and then select Function URL.
- For Auth type, choose AWS_IAM or NONE.
- Select Configure cross-origin resource sharing (CORS). By selecting this option during function creation, your function URL allows requests from all origins by default. You can edit the CORS settings for your function URL after creating the function.
- Choose Create function.
- In the code editor tab of the code source window, copy and paste the code below:
#invocation code
import json
import boto3 #handler code
def lambda_handler(event, context): client = boto3.client('dynamodb') #create AWS SDK Service client’ #simple codeblock for demonstration purposes output = ‘Hello World’ print(output) #handler function return return output
Ensure that the handler code is properly indented.
- Save the code, Deploy, and then Test.
- For the first execution of this Lambda function, a test event configuration dialog will appear. On the Configure test event dialog window, leave the selection as the default (Create new event), enter ‘demo-event’ as the Event name, and leave the hello-world template as the Event template.
- When you run the code by clicking on Test, the console should return ‘Hello World’.
- To simulate actual traffic, let’s run a curl script that will invoke the Lambda function every 0.2 seconds. On a bash terminal, run the following command:
while true; do curl {Lambda Function URL]; sleep 0.06; doneIf you do not have git bash installed, you can use AWS Cloud 9 which supports curl commands.
Enabling CodeGuru Profiler for our Lambda function
We will now set up CodeGuru Profiler to monitor our Lambda function. For Lambda functions running on Java 8 (Amazon Corretto), Java 11, and Python 3.8 or 3.9 runtimes, CodeGuru Profiler can be enabled through a single click in the configuration tab in the AWS Lambda console. Other runtimes can be enabled following a series of steps that can be found in the CodeGuru Profiler documentation for Java and the Python.
Our demo code is written in Python 3.9, so we will enable Profiler from the configuration tab in the AWS Lambda console.
- On the AWS Lambda console, select the demo-function that we created.
- Navigate to Configuration > Monitoring and operations tools, and click Edit on the right side of the page.

- Scroll down to Amazon CodeGuru Profiler and click the button next to Code profiling to turn it on. After enabling Code profiling, click Save.

Note: CodeGuru Profiler requires 5 minutes of Lambda runtime data to generate results. After your Lambda function provides this runtime data, which may need multiple runs if your lambda has a short runtime, it will display within the Profiling group page in the CodeGuru Profiler console. The profiling group will be given a default name (i.e., aws-lambda-<lambda-function-name>), and it will take approximately 15 minutes after CodeGuru Profiler receives the runtime data for this profiling group to appear. Be patient. Although our function duration is ~33ms, our curl script invokes the application once every 0.06 seconds. This should give profiler sufficient information to profile our function in a couple of hours. After 5 minutes, our profiling group should appear in the list of active profiling groups as shown below.

Depending on how frequently your Lambda function is invoked, it can take up to 15 minutes to aggregate profiles, after which you can see your first visualization in the CodeGuru Profiler console. The granularity of the first visualization depends on how active your function was during those first 5 minutes of profiling—an application that is idle most of the time doesn’t have many data points to plot in the default visualization. However, you can remedy this by looking at a wider time period of profiled data, for example, a day or even up to a week, if your application has very low CPU utilization. For our demo function, a recommendation should appear after about an hour. By this time, the profiling groups list should show that our profiling group now has one recommendation.
Profiler has now flagged the repeated creation of the SDK service client with every invocation.
From the information provided, we can see that our CPU is spending 5x more computing time than expected on the recreation of the SDK service client. The estimated cost impact of this inefficiency is also provided. In production environments, the cost impact of seemingly minor inefficiencies can scale very quickly to several kilograms of CO2 and hundreds of dollars as invocation frequency, and the number of Lambda functions increase.
CodeGuru Profiler integrates with Amazon DevOps Guru, a fully managed service that makes it easy for developers and operators to improve the performance and availability of their applications. Amazon DevOps Guru analyzes operational data and application metrics to identify behaviors that deviate from normal operating patterns. Once these operational anomalies are detected, DevOps Guru presents intelligent recommendations that address current and predicted future operational issues. By integrating with CodeGuru Profiler, customers can now view operational anomalies and code optimization recommendations on the DevOps Guru console. The integration, which is enabled by default, is only applicable to Lambda resources that are supported by CodeGuru Profiler and monitored by both DevOps Guru and CodeGuru.
We can now stop the curl loop (Control+C) so that the Lambda function stops running. Next, we delete the profiling group that was created when we enabled profiling in Lambda, and then delete the Lambda function or repurpose as needed.
Conclusion
Cloud sustainability is a shared responsibility between AWS and our customers. While we work to make our datacenter more sustainable, customers also have to work to make their code, resources, and applications more sustainable, and CodeGuru Profiler can help you improve code sustainability, as demonstrated above. To start Profiling your code today, visit the CodeGuru Profiler documentation page. To start monitoring your applications, head over to the Amazon DevOps Guru documentation page.
About the authors:
